From Professional Graphs to ANOVA
This course is designed for scientists who primarily want to use R for statistical data analysis, but also to process data in a comprehensible manner and present it professionally. No prior knowledge of R or any other programming language is required. The main objective of the course is to impart the R syntax and statistical knowledge in an intuitive and applicable manner. Special emphasis is placed on practical application. Therefore, the methods and underlying theory listed below are explained using illustrative examples. The examples used in the course are mainly from agriculture or experimental biology/ecology. The course content is as follows:
R Syntax:
Data Processing:
- Use of the {tidyverse} packages in R
- Various import and export functions; packages: {utils}, {readr}, {readxl}
- Best practice recommendations at various steps of the analysis
- Efficient structuring of data sets and working directories
Statistics:
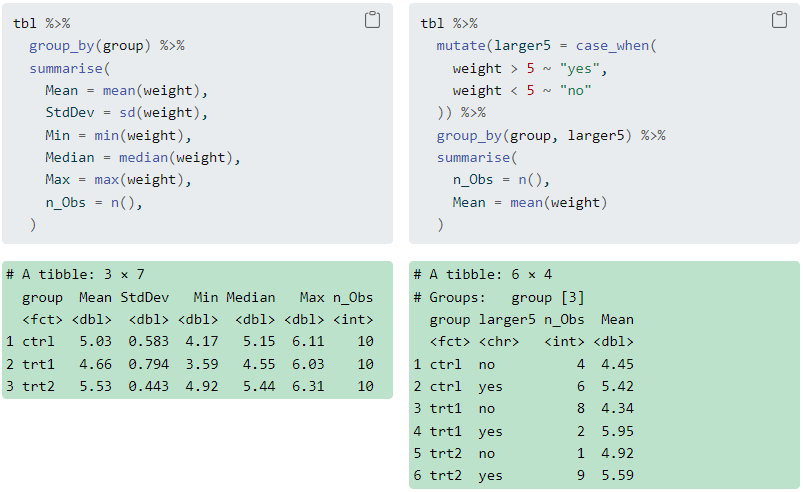
- Efficient creation of relevant descriptive statistics (or: How to use Excel really only for data entry)
- Correlation and linear models (regression)
- Critical discussion of p-values and significance
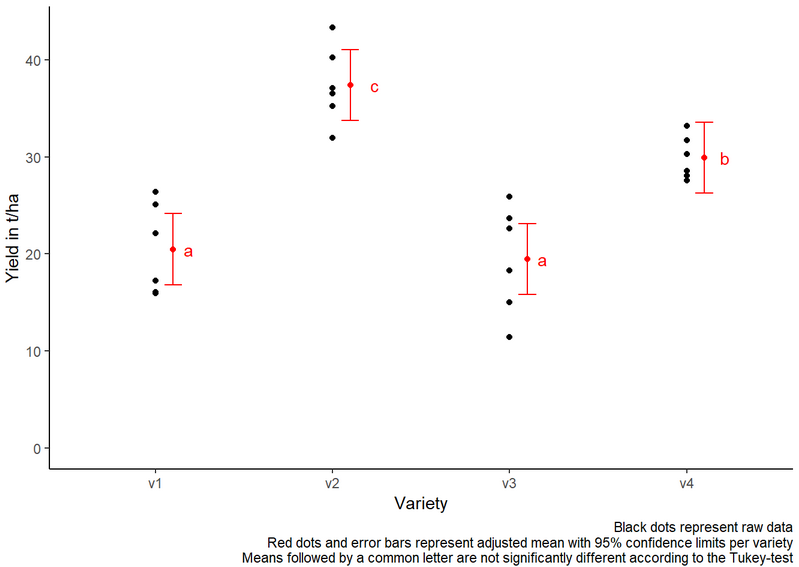
- One-way analysis of variance (ANOVA)
- Checking model prerequisites (normal distribution & homogeneity of variance of residuals)
- Adjusted mean values and their comparisons via post-hoc tests; package: {emmeans}
- Experimental designs
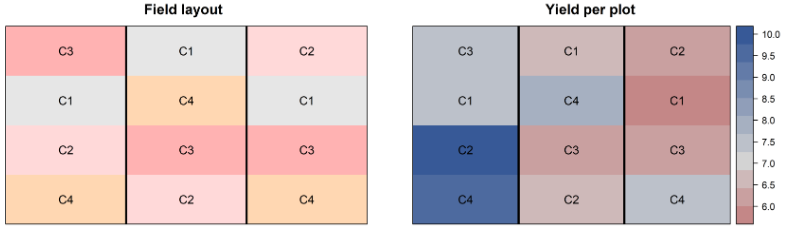
- completely randomized design
- randomized complete block design
Data Preparation:
- Professional creation of various graphs; packages: {ggplot2}, {desplot}
- Export of results to Excel; packages: {broom}, {openxlsx}
Basic statistical knowledge is advantageous. R and RStudio must be installed before the start of the course.
Here are some tips to prepare for my online courses. Scripts for all
my workshops are always available
here and are continuously improved and expanded.